Tracking Progress - 2021 - Part 1
This is from a post in the FB group North Bay Track Riders in June 2021.
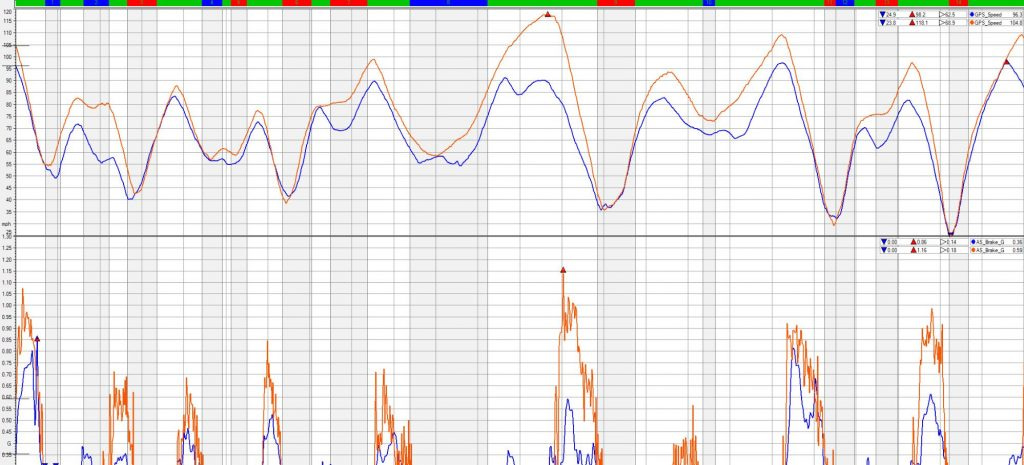
Just for kicks, I've looked at my progress over the last 2.5 years at a couple of tracks. This one is pretty interesting - it's Sonoma from August 2018 vs May 2021. I still have a lot of room for improvement but there are some interesting things that demonstrate so much of what I'm working on: it takes a LOT more brakes to go faster; in a couple of corners, my slow points are slower as I go faster; the slope of the speed graph is far steeper (both in braking and acceleration) with the idea of getting to and away from the slow point faster. Red is May 2021, blue is August 2018. The top graph is the speed trace and the second graph is effective braking force measured in longitudinal g. When I make a big jump in progress I can also use the data to check that I'm not increasing risk (i.e., making sure that I'm taking away lean angle while accelerating).
At present, I'm working on holding the throttle wide open until the braking zone. This requires a more significant involvement and investment to gather data but if you have it, it's very telling. Until I saw the data, I'd have sworn I was wide open until braking but when you have the data, it gives you evidence of what you are (or are not) doing.